This blog will check how LUX python API helps us in data visualization with few lines of code.
Visualization is an important part of the Machine Learning Data Science part because users cannot understand it if we only represent data. However, data visualization clearly shows which one performs better and which one lags. I will walk through with a simple example of how to visualize data.
What is LUX?
Lux is a Python library that makes data science easier by automating certain aspects of the data exploration process. Lux is designed to facilitate faster experimentation with data, even when the user does not have a clear idea of what they are looking for. Lux is integrated with an interactive Jupyter widget that allows users to quickly browse through large collections of data directly within their Jupyter notebooks.
Let’s get into the code part.
In this example, I am using Jypyter Notebook, and you can check the code in the Github repository.
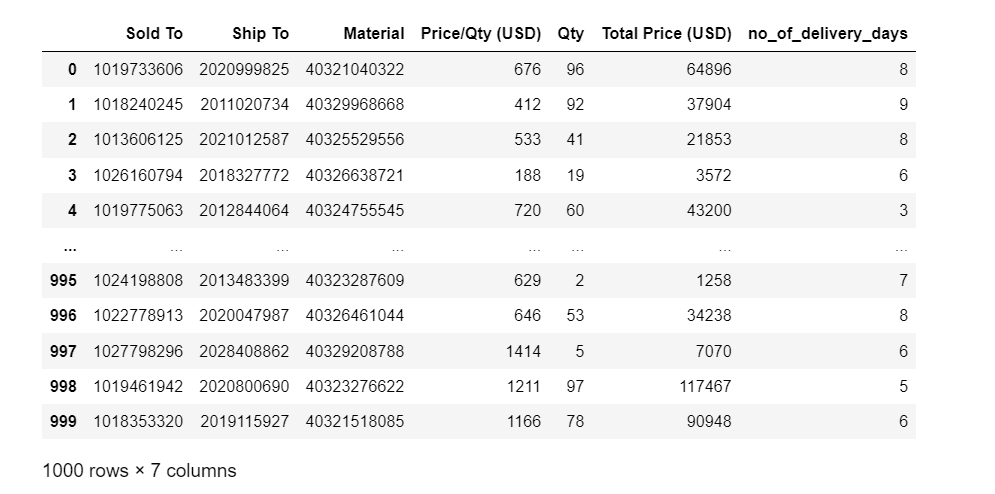
It will show data columns as default, however, if click Toggle Pandas/Lux.
Pandas Columns Tab:
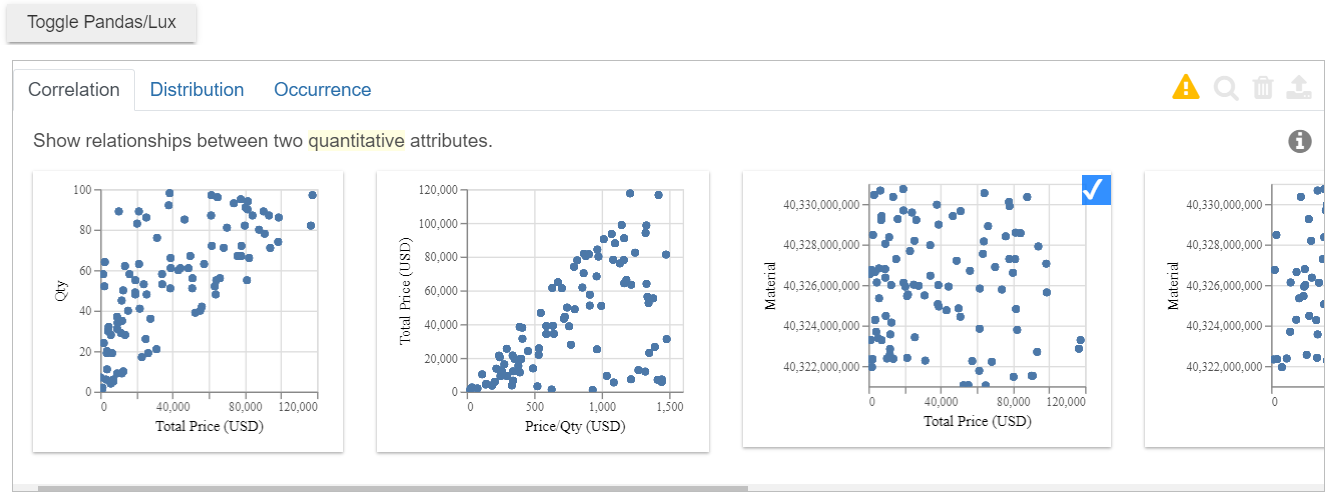
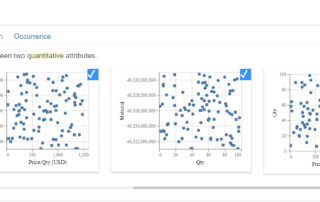
Lux Correlation Tab:
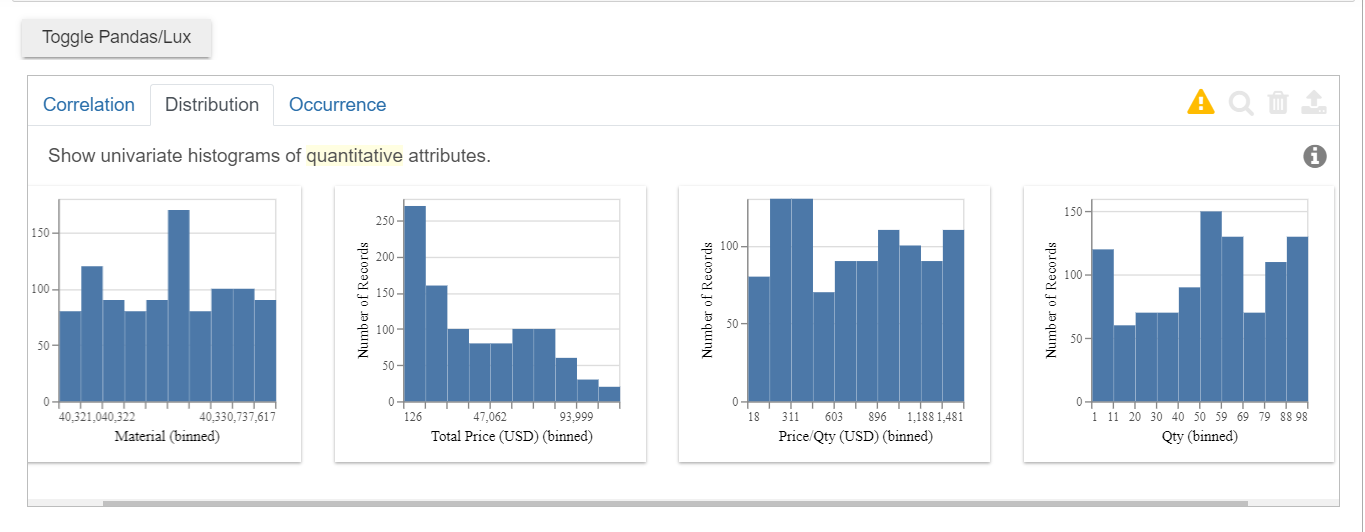
Lux Distribution Tab:
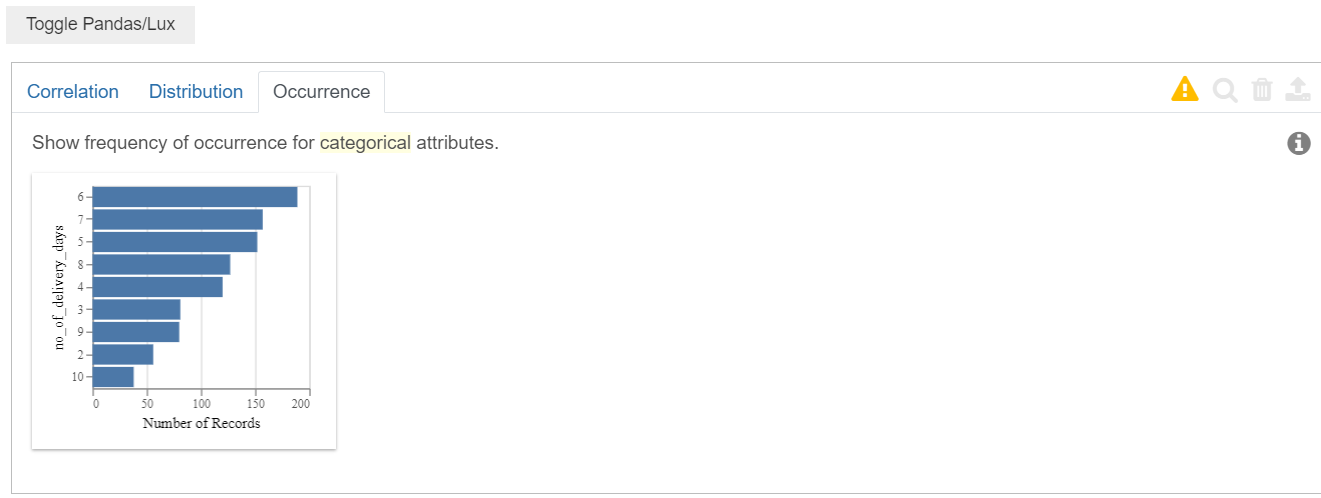
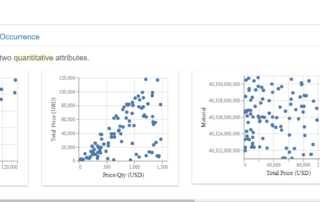
Lux Occurrence Tab:
This is one of the cool library that must have in our machine learning data exploration.
What is your view about this LUX API library? Please comment below
Github repository:
Documentation:
Further Reading
Posts on Artificial Intelligence, Deep Learning, Machine Learning, and Design Thinking articles:
Rasa X Open Source Conversational AI UI Walk-through
Artificial Intelligence Chatbot Using Neural Network and Natural Language Processing




Leave A Comment