We have seen in our previous blog posts Customer Price Prediction on Machine Learning Scikit Learn Linear Regression and Random Forest models. To implement data intelligence, these models can be used in any SAP ERP, SAP ECC, SAP S/4 HANA, Oracle, Microsoft, or any ERP systems with a few custom function calls.
Also, we have gone through Customer Sales Order delivery time/days prediction using the Machine Learning Scikit Decision Tree model.
In this post, we will work on Customer Sales Order Delivery time/Days Prediction using the Scikit Learn Linear Regression model (copy most of the codes from Customer Sales Order delivery time/days prediction) to check how it performs.
Let’s start and see how the Linear Regression predicts “Delivery days data” and you can also download from GitHub on my repository SODeliveryTimePredictionLinReg.


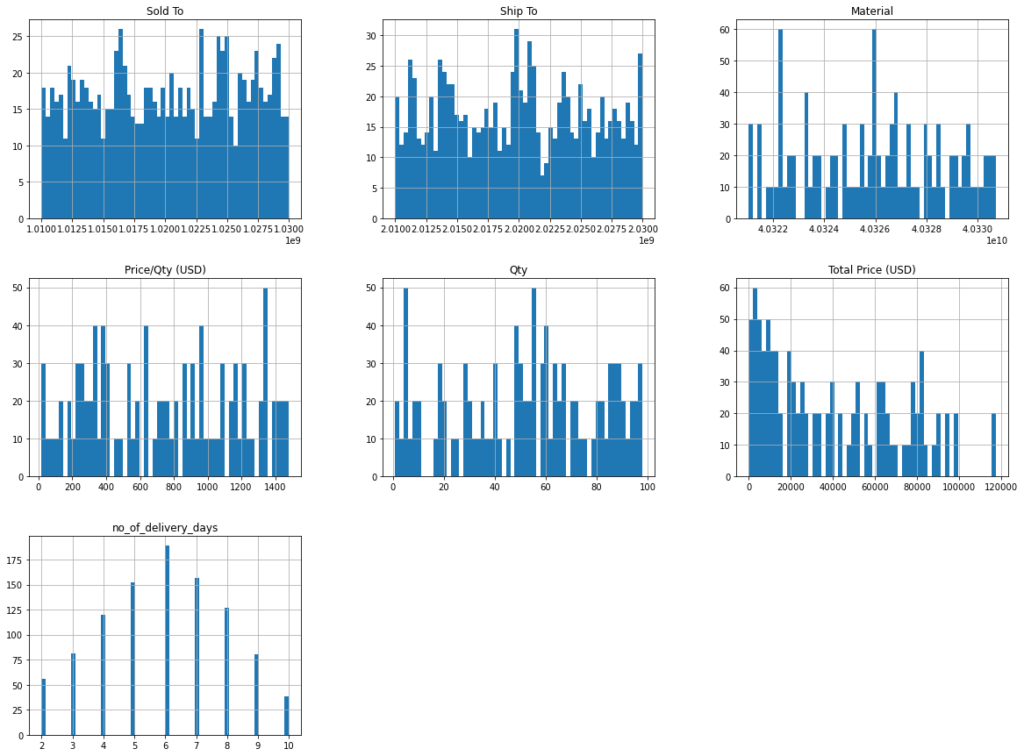
array([[<AxesSubplot:title={'center':'Sold To'}>,
        <AxesSubplot:title={'center':'Ship To'}>,
        <AxesSubplot:title={'center':'Material'}>],
       [<AxesSubplot:title={'center':'Price/Qty (USD)'}>,
        <AxesSubplot:title={'center':'Qty'}>,
        <AxesSubplot:title={'center':'Total Price (USD)'}>],
       [<AxesSubplot:title={'center':'no_of_delivery_days'}>,
        <AxesSubplot:>, <AxesSubplot:>]], dtype=object)


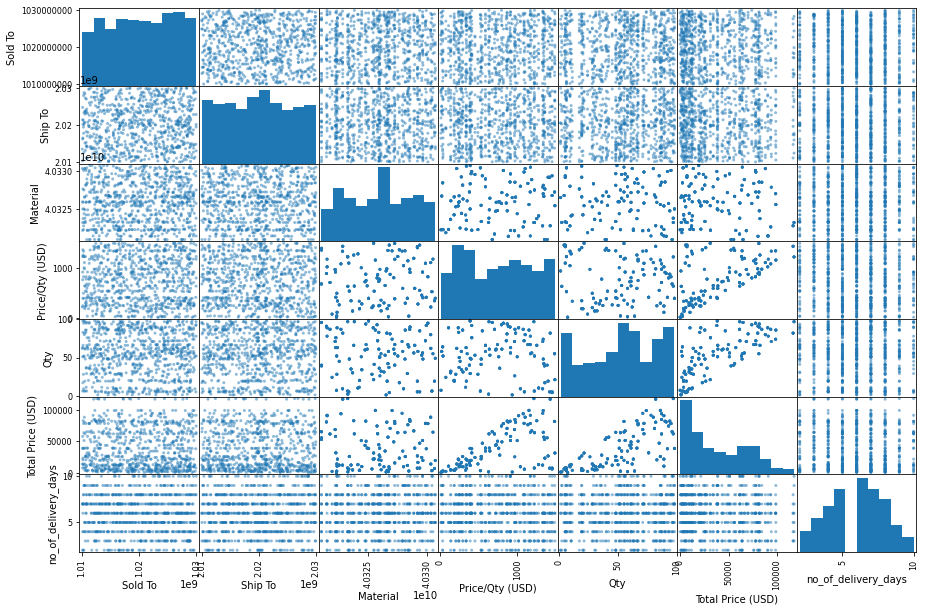
array([[<AxesSubplot:xlabel='Sold To', ylabel='Sold To'>,
        <AxesSubplot:xlabel='Ship To', ylabel='Sold To'>,
        <AxesSubplot:xlabel='Material', ylabel='Sold To'>,
        <AxesSubplot:xlabel='Price/Qty (USD)', ylabel='Sold To'>,
        <AxesSubplot:xlabel='Qty', ylabel='Sold To'>,
        <AxesSubplot:xlabel='Total Price (USD)', ylabel='Sold To'>,
        <AxesSubplot:xlabel='no_of_delivery_days', ylabel='Sold To'>],
       [<AxesSubplot:xlabel='Sold To', ylabel='Ship To'>,
        <AxesSubplot:xlabel='Ship To', ylabel='Ship To'>,
        <AxesSubplot:xlabel='Material', ylabel='Ship To'>,
        <AxesSubplot:xlabel='Price/Qty (USD)', ylabel='Ship To'>,
        <AxesSubplot:xlabel='Qty', ylabel='Ship To'>,
        <AxesSubplot:xlabel='Total Price (USD)', ylabel='Ship To'>,
        <AxesSubplot:xlabel='no_of_delivery_days', ylabel='Ship To'>],
       [<AxesSubplot:xlabel='Sold To', ylabel='Material'>,
        <AxesSubplot:xlabel='Ship To', ylabel='Material'>,
        <AxesSubplot:xlabel='Material', ylabel='Material'>,
        <AxesSubplot:xlabel='Price/Qty (USD)', ylabel='Material'>,
        <AxesSubplot:xlabel='Qty', ylabel='Material'>,
        <AxesSubplot:xlabel='Total Price (USD)', ylabel='Material'>,
        <AxesSubplot:xlabel='no_of_delivery_days', ylabel='Material'>],
       [<AxesSubplot:xlabel='Sold To', ylabel='Price/Qty (USD)'>,
        <AxesSubplot:xlabel='Ship To', ylabel='Price/Qty (USD)'>,
        <AxesSubplot:xlabel='Material', ylabel='Price/Qty (USD)'>,
        <AxesSubplot:xlabel='Price/Qty (USD)', ylabel='Price/Qty (USD)'>,
        <AxesSubplot:xlabel='Qty', ylabel='Price/Qty (USD)'>,
        <AxesSubplot:xlabel='Total Price (USD)', ylabel='Price/Qty (USD)'>,
        <AxesSubplot:xlabel='no_of_delivery_days', ylabel='Price/Qty (USD)'>],
       [<AxesSubplot:xlabel='Sold To', ylabel='Qty'>,
        <AxesSubplot:xlabel='Ship To', ylabel='Qty'>,
        <AxesSubplot:xlabel='Material', ylabel='Qty'>,
        <AxesSubplot:xlabel='Price/Qty (USD)', ylabel='Qty'>,
        <AxesSubplot:xlabel='Qty', ylabel='Qty'>,
        <AxesSubplot:xlabel='Total Price (USD)', ylabel='Qty'>,
        <AxesSubplot:xlabel='no_of_delivery_days', ylabel='Qty'>],
       [<AxesSubplot:xlabel='Sold To', ylabel='Total Price (USD)'>,
        <AxesSubplot:xlabel='Ship To', ylabel='Total Price (USD)'>,
        <AxesSubplot:xlabel='Material', ylabel='Total Price (USD)'>,
        <AxesSubplot:xlabel='Price/Qty (USD)', ylabel='Total Price (USD)'>,
        <AxesSubplot:xlabel='Qty', ylabel='Total Price (USD)'>,
        <AxesSubplot:xlabel='Total Price (USD)', ylabel='Total Price (USD)'>,
        <AxesSubplot:xlabel='no_of_delivery_days', ylabel='Total Price (USD)'>],
       [<AxesSubplot:xlabel='Sold To', ylabel='no_of_delivery_days'>,
        <AxesSubplot:xlabel='Ship To', ylabel='no_of_delivery_days'>,
        <AxesSubplot:xlabel='Material', ylabel='no_of_delivery_days'>,
        <AxesSubplot:xlabel='Price/Qty (USD)', ylabel='no_of_delivery_days'>,
        <AxesSubplot:xlabel='Qty', ylabel='no_of_delivery_days'>,
        <AxesSubplot:xlabel='Total Price (USD)', ylabel='no_of_delivery_days'>,
        <AxesSubplot:xlabel='no_of_delivery_days', ylabel='no_of_delivery_days'>]],
      dtype=object)
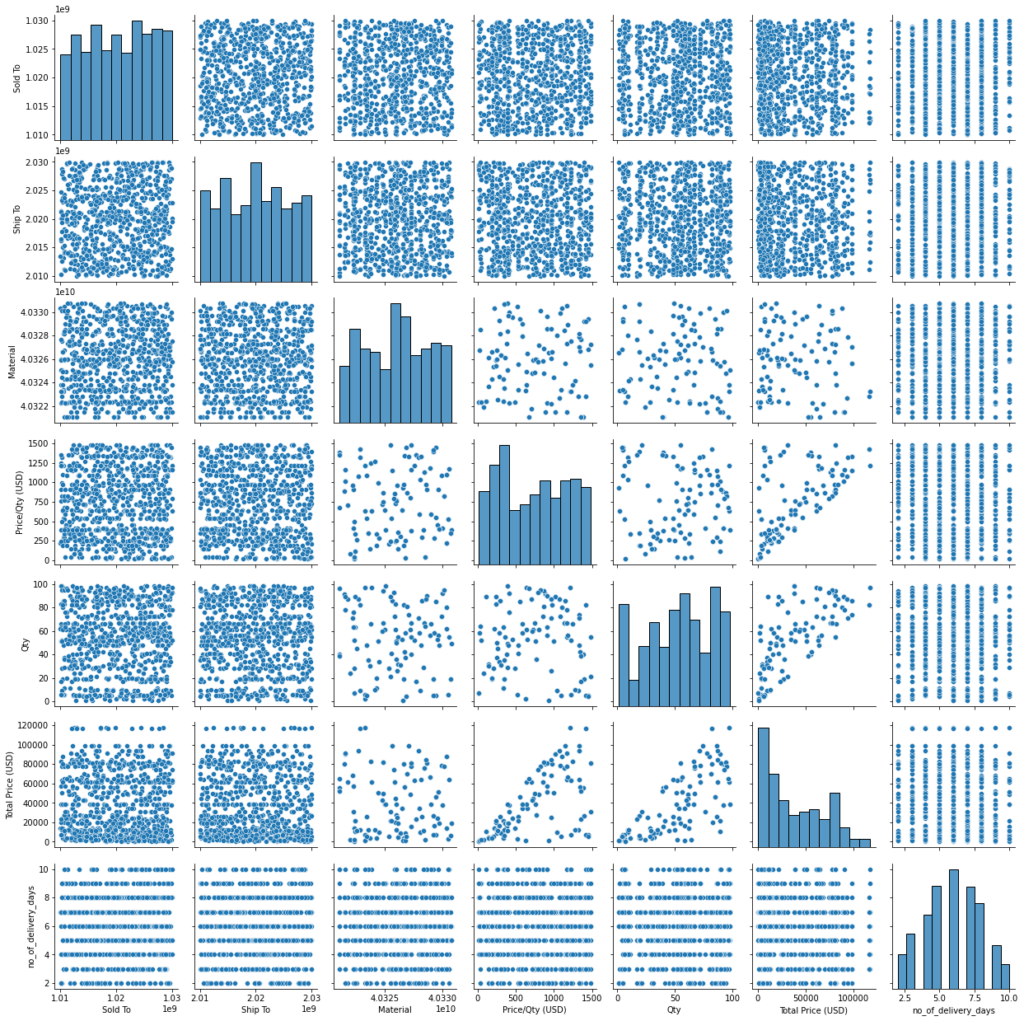
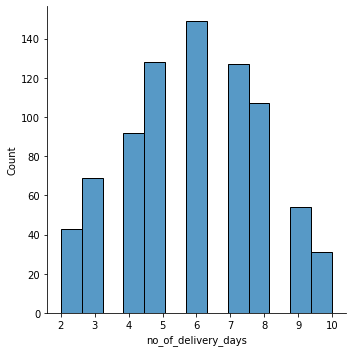
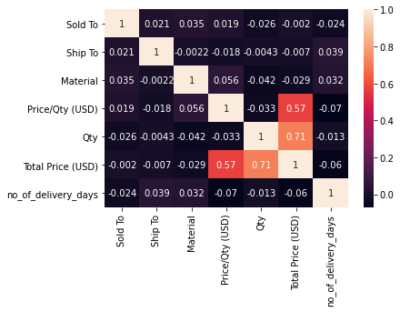

29     6
535    3
695    8
557    5
836    9
Name: no_of_delivery_days, dtype: int64
array([[ 1.26234643,  0.9764221 ,  0.22314994,  0.44560793, -1.83483918,
        -1.20757264],
       [ 0.12700257, -0.14113953,  0.96411821,  0.52720777,  1.18937949,
         1.43120235],
       [-0.06301307, -0.53241671, -0.97728689, -0.26314488, -1.79967385,
        -1.1972752 ],
       ...,
       [ 1.23018703,  1.18247717,  0.81514727,  1.37584601, -0.18206851,
         0.78864196],
       [-1.14424485, -1.45886269,  0.96411821,  0.52720777,  1.18937949,
         1.43120235],
       [-0.97055635, -0.566122  , -0.15123758, -0.48696156, -0.42822585,
        -0.54473421]])
Linear Regression Delivery Time Prediction Y hat: [5.95472277 5.82839246 5.865961   6.11605011 5.87632342 6.00736195
 6.14989908 5.57412421 5.96879614 5.78954528]
Linear Regression Delivery Time Actual Y:  [6, 3, 8, 5, 9, 6, 6, 7, 8, 5]
Linear Regression Delivery Time Mean Squared Error:  4.133815160967546
Linear Regression Delivery Time Root Mean Squared Error:  2.03317858560618
array([2.1075037 , 2.01119134, 1.99501959, 2.10346173, 2.12278686,
       2.20096382, 1.8970202 , 2.25789998, 2.01952369, 1.75446876])
Scores:  [2.1075037  2.01119134 1.99501959 2.10346173 2.12278686 2.20096382
 1.8970202  2.25789998 2.01952369 1.75446876]
Mean:  2.046983967772923
Standard deviation:  0.13913431138563676
Conclusion on Scikit Learn – Linear Regression Model in Sales Order Delivery Time Prediction:
- Linear Regression is a powerful model. However, it is not giving the best results as mean squared error 4 days if it is 1 or 2 days then we can check. The Linear Regression model is not performing well on delivery time prediction, however, we can compare with Random Forest and Decision Tree and we can conclude in a couple of blogs which one performs better.
- The model is overfitting the data very badly.
- Linear Regression Scores shows in the range of 1.7 to 2.3, however, Decision Tree shows 2.6 to 3.3.
- We will check in Random Forest as it was doing a pretty good job on Customer Price Prediction and it was nearly accurate and fewer errors.
Further Reading
Posts on Artificial Intelligence, Deep Learning, Machine Learning, and Design Thinking articles:
Artificial Intelligence in Hollywood Movies
Translate 125 Plus Languages Using Google Artificial Intelligence – Part 1
Thinking Humanly: The cognitive modeling approach – Artificial Intelligence



Leave A Comment